Ready to learn Data Science? Browse courses like Data Science Training and Certification developed by industry thought leaders and Experfy in Harvard Innovation Lab.
Missing values are representative of the messiness of real world data. There can be a multitude of reasons why they occur — ranging from human errors during data entry, incorrect sensor readings, to software bugs in the data processing pipeline.
The normal reaction is frustration. Missing data are probably the most widespread source of errors in your code, and the reason for most of the exception-handling. If you try to remove them, you might reduce the amount of data you have available dramatically — probably the worst that can happen in machine learning.
Still, often there are hidden patterns in missing data points. Those patterns can provide additional insight in the problem you’re trying to solve.
We can treat missing values in data the same way as silence in music — on the surface they might be considered negative (not contributing any information), but inside lies a lot of potential.
Methods
Note: we will be using Python and a census data set (modified for the purposes of this tutorial)
You might be surprised to find out how many methods for dealing missing data exist. This is a testament to both how important this issue is, and also that there is a lot of potential for creative problem solving.
The first thing you should do is count how many you have and try to visualize their distributions. For this step to work properly you should manually inspect the data (or at least a subset of it) to try to determine how they are designated. Possible variations are: ‘NaN’, ‘NA’, ‘None’, ‘ ’, ‘?’ and others. If you have something different than ‘NaN’ you should standardize them by using np.nan. To construct our visualizations we will use the handy missingnopackage.
import missingno as msno
msno.matrix(census_data)
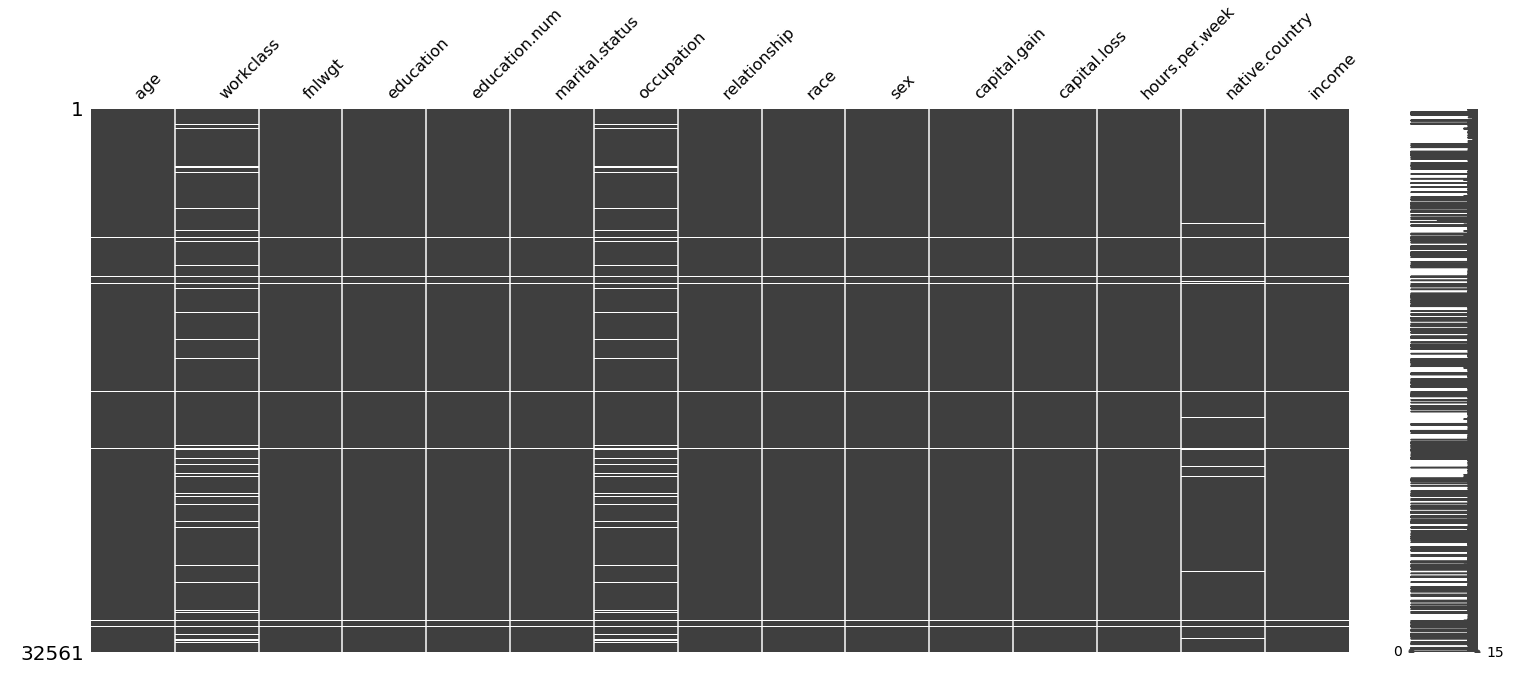
Missing data visualisation. White fields indicate NA’s
import pandas as pd
census_data.isnull().sum()
age 325
workclass 2143
fnlwgt 325
education 325
education.num 325
marital.status 325
occupation 2151
relationship 326
race 326
sex 326
capital.gain 326
capital.loss 326
hours.per.week 326
native.country 906
income 326
dtype: int64
Let’s start with the most simple thing you can do: removal. As mentioned before, while this is a quick solution, and might work in some cases when the proportion of missing values is relatively low (<10%), most of the time it will make you lose a ton of data. Imagine that just because of missing values in one of your features you have to drop the whole observation, even if the rest of the features are perfectly filled and informative!
import numpy as np
census_data = census_data.replace('np.nan', 0)
The second-worst method of doing this is replacement with 0 (or -1). While this would help you run your models, it can be extremely dangerous. The reason for this is that sometimes this value can be misleading. Imagine a regression problem where negative values occur (such as predicting temperature) — well in that case this becomes an actual data point.
Now that we have those out of the way, let’s become more creative. We can split the type of missing values by their parent datatype:
Numerical NaNs
A standard and often very good approach is to replace the missing values with mean, median or mode. For numerical values you should go with mean, and if there are some outliers try median (since it is much less sensitive to them).
from sklearn.preprocessing import Imputer
imputer = Imputer(missing_values=np.nan, strategy='median', axis=0)
census_data[['fnlwgt']] = imputer.fit_transform(census_data[['fnlwgt']])
Categorical NaNs
Categorical values can be a bit trickier, so you should definitely pay attention to your model performance metrics after editing (compare before and after). The standard thing to do is to replace the missing entry with the most frequent one:
census_data['marital.status'].value_counts()
Married-civ-spouse 14808
Never-married 10590
Divorced 4406
Separated 1017
Widowed 979
Married-spouse-absent 413
Married-AF-spouse 23
Name: marital.status, dtype: int64
def replace_most_common(x):
if pd.isnull(x):
return most_common
else:
return x
census_data = census_data['marital.status'].map(replace_most_common)
Conclusion
The take-home message is that you should be aware of the different methods available to get more out of missing data, and more importantly start regarding it as a source of possible insight instead of annoyance!
Happy coding 🙂
Bonus — advanced methods and visualizations
You can theoretically impute missing values by fitting a regression model, such as linear regression or k nearest neighbors. The implementation of this is left as an example to the reader.
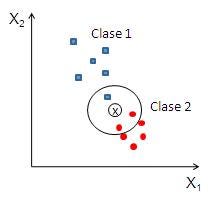
A visual example of kNN.
Here are some visualisations that are also available from the wonderful missingno package, which can help you uncover relationships, in the form of a correlation matrix or a dendrogram:
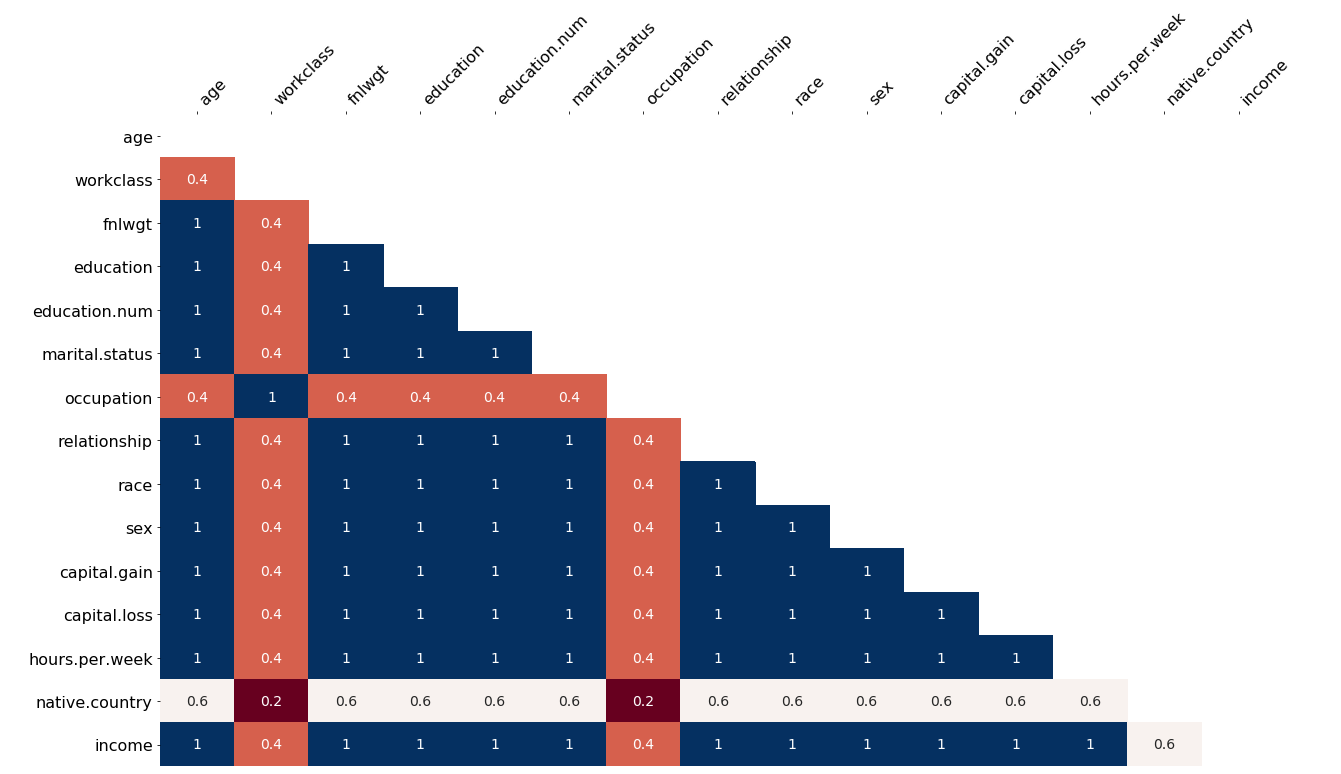
Correlation matrix of missing values. Values which are often missing together can help you solve the problem.
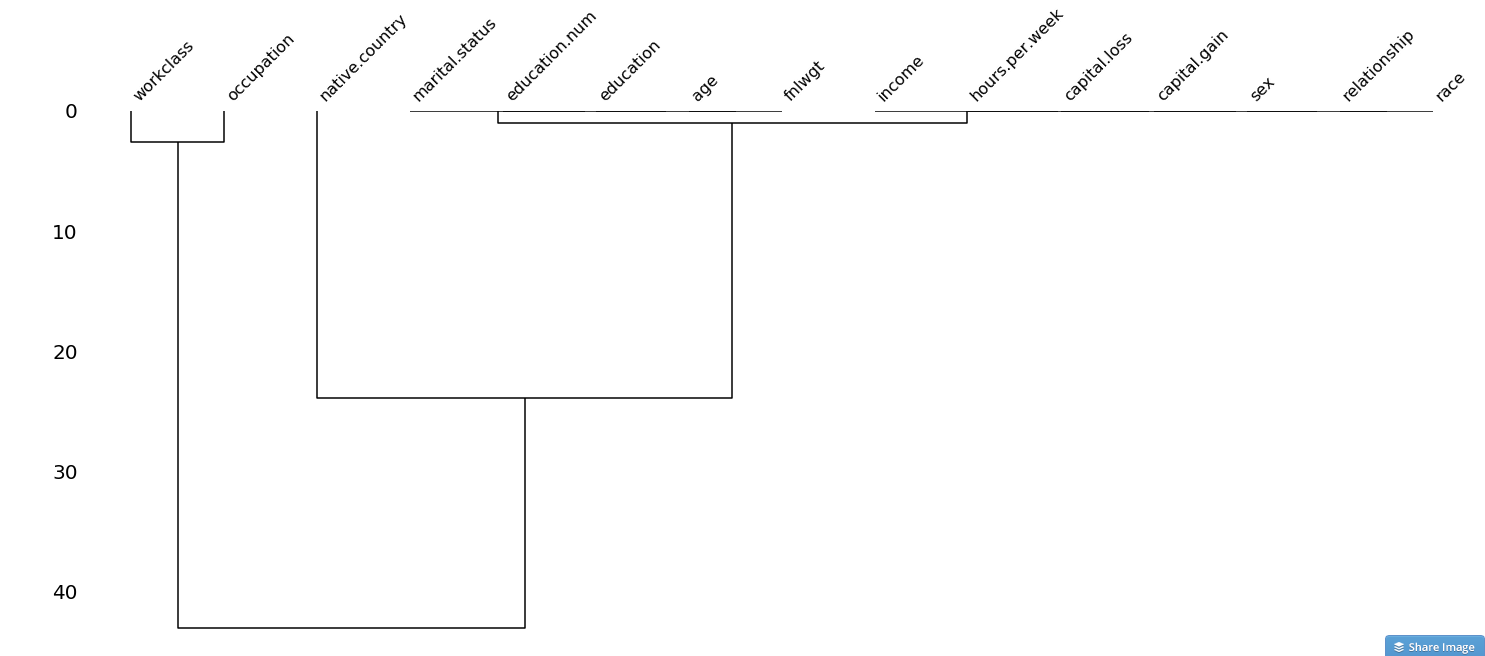
Dendrogram of missing values