Ready to learn Data Science? Browse courses like Data Science Training and Certification developed by industry thought leaders and Experfy in Harvard Innovation Lab.
In this article, we show how to use Python libraries and HTML parsing to extract useful information from a website and answer some important analytics questions afterwards.
Ina data science project, almost always the most time consuming and messy part is the data gathering and cleaning. Everyone likes to build a cool deep neural network (or XGboost) model or two and show off one’s skills with cool 3D interactive plots. But the models need raw data to start with and they don’t come easy and clean.
Life, after all, is not Kaggle where a zip file full of data is waiting for you to be unpacked and modeled 🙂
But why gather data or build model anyway? The fundamental motivation is to answer a business or scientific or social question. Is there a trend? Is this thing related to that? Can the measurement of this entity predict the outcome for that phenomena? It is because answering this question will validate a hypothesis you have as a scientist/practitioner of the field. You are just using data (as opposed to test tubes like a chemist or magnets like a physicist) to test your hypothesis and prove/disprove it scientifically. That is the ‘science’ part of the data science. Nothing more, nothing less…
Trust me, it is not that hard to come up with a good quality question which requires a bit of application of data science techniques to answer. Each such question then becomes a small little project of your which you can code up and showcase on a open-source platform like Github to show to your friends. Even if you are not a data scientist by profession, nobody can stop you writing cool program to answer a good data question. That showcases you as a person who is comfortable around data and one who can tell a story with data.
Let’s tackle one such question today…
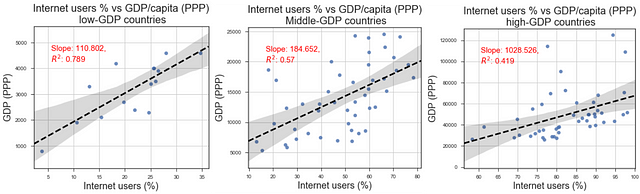
Is there any relationship between the GDP (in terms of purchasing power parity) of a country and the percentage of its Internet users? And is this trend similar for low-income/middle-income/high-income countries?
Now, there can be any number of sources you can think of to gather data for answering this question. I found that an website from CIA (Yes, the ‘AGENCY’), which hosts basic factual information about all countries around the world, is a good place to scrape the data from.
So, we will use following Python modules to build our database and visualizations,
- Pandas, Numpy, matplotlib/seaborn
- Python urllib (for sending the HTTP requests)
- BeautifulSoup (for HTML parsing)
- Regular expression module (for finding the exact matching text to search for)
Let’s talk about the program structure to answer this data science question. The entire boiler plate code is available here in my Github repository. Please feel free to fork and star if you like it.
Reading the front HTML page and passing on to BeautifulSoup
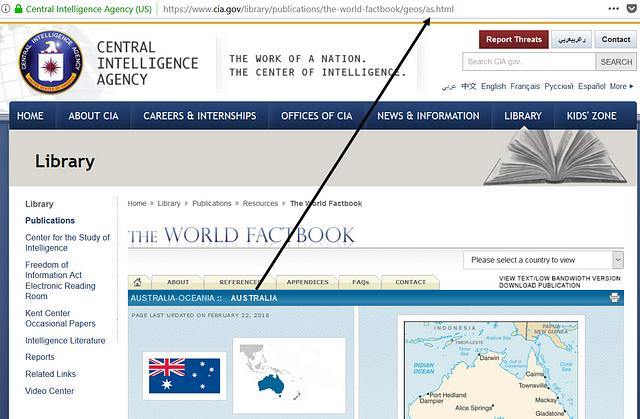
Here is how the front page of the CIA World Factbook looks like,

Fig: CIA World Factbook front page
We use a simple urllib request with a SSL error ignore context to retrieve this page and then pass it on to the magical BeautifulSoup, which parses the HTML for us and produce a pretty text dump. For those, who are not familiar with the BeautifulSoup library, they can watch the following video or read this great informative article on Medium.
So, here is the code snippet for reading the front page HTML,
Here is how we pass it on to BeautifulSoup and use the find_all method to find all the country names and codes embedded in the HTML. Basically, the idea is to find the HTML tags named ‘option’. The text in that tag is the country name and the char 5 and 6 of the tag value represent the 2-character country code.
Now, you may ask how would you know that you need to extract 5th and 6th character only? The simple answer is that you have to examine the soup text i.e. parsed HTML text yourself and determine those indices. There is no universal method to determine this. Each HTML page and the underlying structure is unique.
Crawling: Download all the text data of all countries into a dictionary by scraping each page individually
This step is the essential scraping or crawling as they say. To do this, the key thing to identify is how the URL of each countries information page is structured. Now, in general case, this is may be hard to get. In this particular case, quick examination shows a very simple and regular structure to follow. Here is the screenshot of Australia for example,
That means there is a fixed URL to which you have to append the 2-character country code and you get to the URL of that country’s page. So, we can just iterate over the country codes’ list and use BeautifulSoup to extract all the text and store in our local dictionary. Here is the code snippet,
Store in a Pickle dump if you like
For good measure, I prefer to serialize and store this data in a Python pickle object anyway. That way I can just read the data directly next time I open the Jupyter notebook without repeating the web crawling steps.
Using regular expression to extract the GDP/capita data from the text dump
This is the core text analytics part of the program, where we take help of regular expression module to find what we are looking for in the huge text string and extract the relevant numerical data. Now, regular expression is a rich resource in Python (or in virtually every high level programming language). It allows searching/matching particular pattern of strings within a large corpus of text. Here, we use very simple methods of regular expression for matching the exact words like “GDP — per capita (PPP):” and then read few characters after that, extract the positions of certain symbols like $ and parentheses to eventually extract the numerical value of GDP/capita. Here is the idea illustrated with a figure.
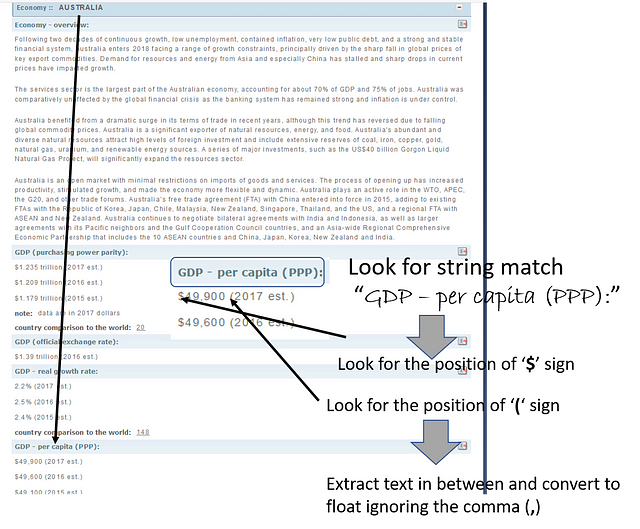
Fig: Illustration of the text analytics
There are other regular expression tricks used in this notebook, for example to extract the total GDP properly regardless whether the figure is given in billions or trillions.
Here is the example code snippet. Notice the multiple error-handling checks placed in the code. This is necessary because of the supremely unpredictable nature of HTML pages. Not all country may have the GDP data, not all pages may have the exact same wordings for the data, not all numbers may look same, not all strings may have $ and () placed similarly. Any number of things can go wrong.
It is almost impossible to plan and write code for all scenarios but at least you have to have code to handle the exception if they occur so that your program does not come to a halt and can gracefully move on to the next page for processing.
Don’t forget to use pandas inner/left join method
One thing to remember is that all these text analytics will produce dataframes with slightly different set of countries as different types of data may be unavailable for different countries. One could use a Pandas left join to create a dataframe with intersection of all common countries for which all the pieces of data is available/could be extracted.
Ah the cool stuff now, Modeling…but wait! Let’s do filtering first!
After all the hard work of HTML parsing, page crawling, and text mining, now you are ready to reap the benefits — eager to run the regression algorithms and cool visualization scripts! But wait, often you need to clean up your data (particularly for this kind of socio-economic problems) a wee bit more before generating those plots. Basically, you want to filter out the outliers e.g. very small countries (like island nations) who may have extremely skewed values of the parameters you want to plot but does not follow the main underlying dynamics you want to investigate. A few lines of code is good for those filters. There may be more Pythonic way to implement them but I tried to keep it extremely simple and easy to follow. The following code, for example, creates filters to keep out small countries with < 50 billion of total GDP and low and high income boundaries of $5,000 and $25,000 respectively (GDP/capita).
Finally, the visualization
We use seaborn regplot function to create the scatter plots (Internet users % vs. GDP/capita) with linear regression fit and 95% confidence interval bands shown. They look like following. One can interpret the result as
There is a strong positive correlation between Internet users % and GDP/capita for a country. Moreover, the strength of correlation is significantly higher for low-income/low-GDP countries than the high-GDP, advanced nations. That could mean access to internet helps the lower income countries to grow faster and improve the average condition of their citizens more than it does for the advanced nations.
Summary
This article goes over a demo Python notebook to illustrate how to crawl web pages for downloading raw information by HTML parsing using BeautifulSoup. Thereafter, it also illustrates the use of Regular Expression module to search and extract important pieces of information what the user demands.
Above all, it demonstrates how or why there can be no simple, universal rule or program structure while mining messy HTML parsed texts. One has to examine the text structure and put in place appropriate error-handling checks to gracefully handle all the situations to maintain the flow of the program (and not crash) even if it cannot extract data for all those scenarios.