Part 1: Your First Web App in Just a Few Lines of Code
In this article, I will show you how you can quickly build a simple data-driven web app using the streamlit Python library in just a few lines of code.
As a Data Scientist or Machine Learning Engineer, it is important to be able to deploy our data science project. Traditional deployment of machine learning models with established framework such as Django or Flask may be a daunting and/or time-consuming task.
This article is based on a YouTube video that I made on the same topic (How to Build Your First Data Science Web App in Python) in which you can watch it alongside reading this article.https://cdn.embedly.com/widgets/media.html?
Overview of the stock web app that we are building
Today, we will be building a simple web app that displays the stock price and volume. This will require the use of two Python libraries namely streamlit and yfinance. Conceptually, the app will retrieve historical market data from Yahoo! Finance from the yfinance library. This data is saved into a dataframe and streamlit will use this data as input argument for displaying it as a line chart.
Install prerequisite libraries
In this tutorial, we will be using two Python libraries that require installation. These include streamlit and yfinance. You can easily do this via thepip install command as follows to install streamlit:
pip install streamlit
And do the same also for yfinance as follows:
pip install yfinance
Code of the web app
Let’s take a look at the code of the web app that we are building today. You will see that there is less less than 20 lines of code (i.e. if not counting the comments then that trims it down to 14 lines of code where 3 of those lines are empty lines for aesthetic purpose).
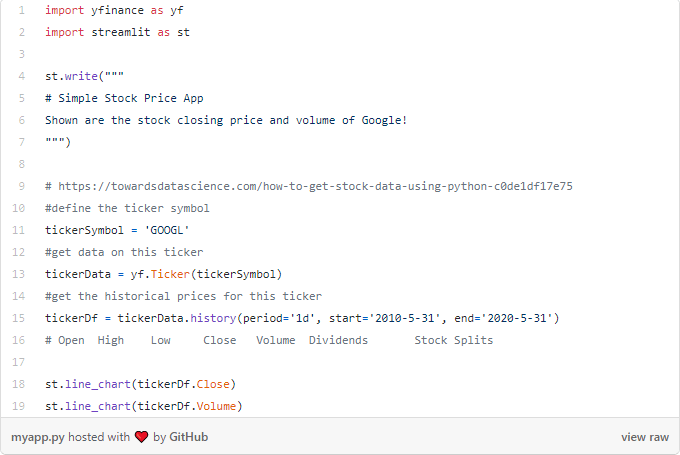
Line-by-line explanation of the code
Let’s take some time to make some understanding of the above code.
- Lines 1 and 2
Importsyfinanceand assigning it the alias ofyfas well as importingstreamlitand assigning it the alias ofst. - Lines 4–7
Uses thest.write()function to print out text. These printed out text are written in markdown format. - Lines 9–16
Uses theyfinancelibrary to retrieve historical market data from Yahoo! Finance.
* Line 11 — Defines the ticker symbol asGOOGL.
* Line 13 — Creates thetickerDatavariable using theyf.Ticker()function that as the name imply allows access to the ticker data. It should be noted that the tickerData is a Ticker object and if we run tickerData as a command we get the following outputyfinance.Ticker object <GOOGL>.
* Line 15 — Creates thetickerDfdataframe and defines the date range (from May 31, 2010 to May 31, 2020) and time period (1 day).

- Lines 18 and 19
Uses thest.line_chart()function to plot a line chart (using the close price from the Close and Volume columns from thetickerDfdataframe as defined on line 15.
Running the web app
After saving the code into a file called myapp.py, fire up the command prompt (or Power Shell in Microsoft Windows) and run the following command:
streamlit run myapp.py
Next, we should see the following message:
> streamlit run myapp.pyYou can now view your Streamlit app in your browser.Local URL: http://www.experfy.com:8501
Network URL: http://10.0.0.11:8501
In a short moment, an internet browser window should pop-up and directs you to the created web app by taking you to http://www.experfy.com:8501 as shown below.
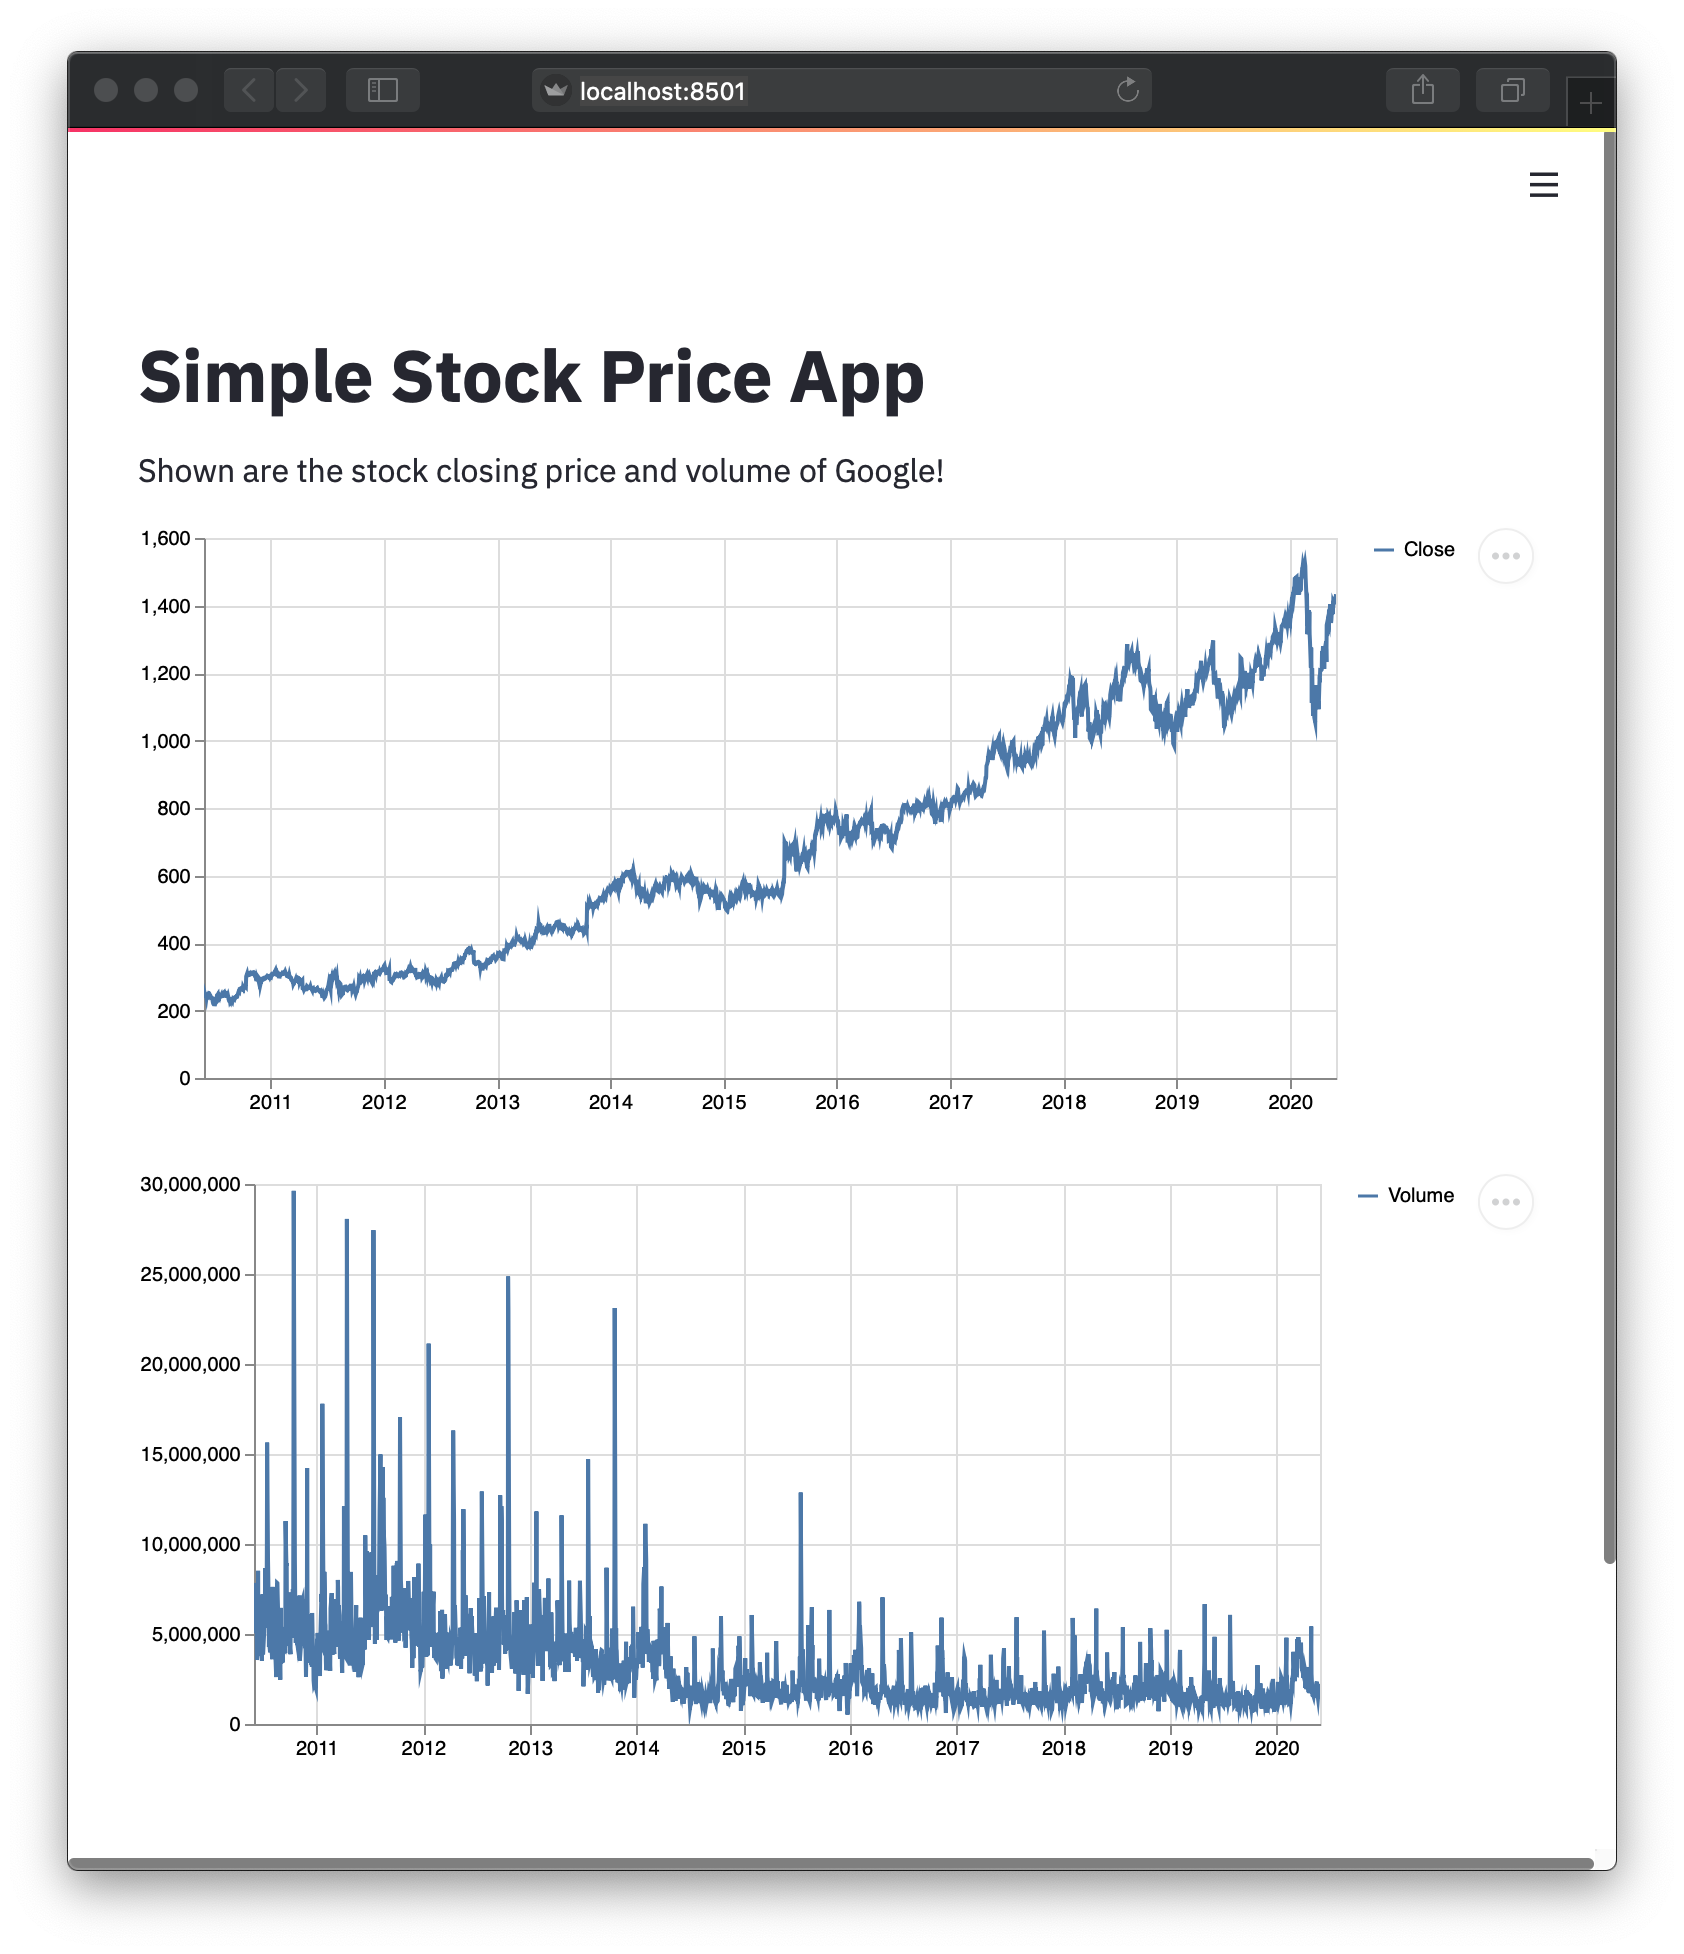
Congratulations! You have created your first web app in Python!
Customizing the web app
Okay, so you probably want to spice things up a bit and customize the web app.

Let’s take some time to make some understanding of the above code.
- Line 6
Notice that we bold the “closing price” using two asterisks in front and behind the phrase as follows:**closing price**. Also notice that we made the word “volume” to be both bold and in italic form by using three asterisks in front and behind the word as follows:***volume***. - Line 18–20 and 22–25
Here we added a header titles in markdown format right before the closing price and the volume plots.

Voila!
And now we have an updated web app that should automatically update right before your eyes.