Ready to learn Data Science? Browse Data Science Training and Certification courses developed by industry thought leaders and Experfy in Harvard Innovation Lab.
Today, I will present a Machine Learning application of Topological Data Analysis (TDA), a rapidly evolving field of data science which makes use of topology to improve data analysis.
Great! Wait… what is TDA?
I will start by briefly recalling the basics of TDA. The interested reader might also want to take a look at other stories (and all references therein) for further details.
TDA is a mathematically grounded theory which aims at characterizing data using its topology, which is done by computing features of topological nature. The most common one is the persistence diagram, which takes the form of a set of points in the plane above the diagonal.
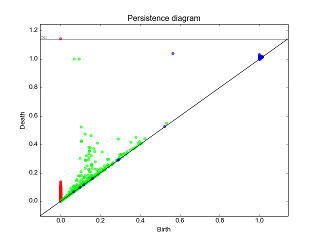
Example of persistence diagram computed with the library Gudhi. Source: http://gudhi.gforge.inria.fr/python/latest/persistence_graphical_tools_user.html
Each of such point represents a topological feature (such as a connected component, a hole or a cavity) of the data. Moreover, the distance of the point to the diagonal act as an indicator of the importance of the corresponding feature, the usual interpretation being that points close to the diagonal are likely due to noise.
The computation of such diagrams requires a filtration, that is, a sequence of growing spaces: each space in the sequence is included in the next one. For instance, given a point cloud, a possible filtration would be to compute unions of balls centered on the points with a sequence of increasing radii.
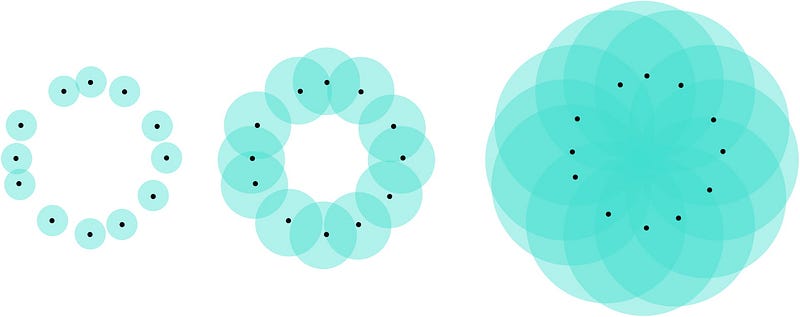
Example of union of balls filtration.
The idea is then, for each space in the sequence, to record whether a topological feature is either created or destroyed in that space. For instance, if we consider the union of balls filtration, it may happen that, for some radius, the ball union contains a hole, which persists for some time until it eventually gets filled in when the balls have a sufficiently large radius, which is exactly what happens in the filtration displayed above. These radii can then be used as coordinates to create a point in the plane which represents this hole.
Sounds good but… I want an application!
Persistence diagrams have many applications in various fields of data analysis. In this note, I will present a visual application in geometry processing, namely 3D shape segmentation.
3D shapes are usually stored as a set of points, edges and triangles in a computer. The goal of segmentation is to provide labels for each point of each shape. For instance, if you are given a bunch of 3D shapes representing humans, the goal of segmentation is to successfully assign for each point the body part to which it belongs (“torso”, “arm”, “leg”…).
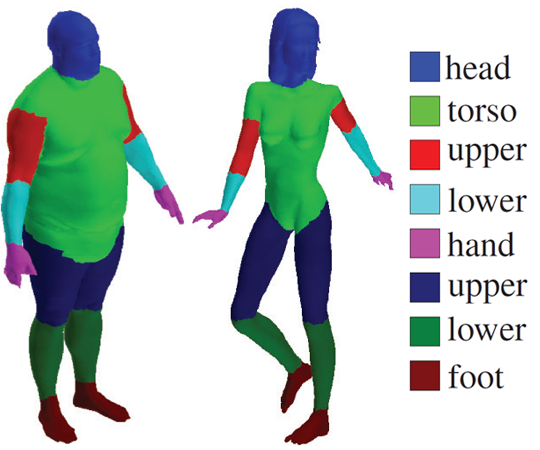
Segmented 3D human shapes. The different colors correspond to the different labels or parts. Source: https://people.cs.umass.edu/~kalo/papers/LabelMeshes/
The difficulty of this problem lies in the fact that you are only given point coordinates, which are poor features. Indeed, it is hopeless to characterize a point with its coordinates since they depend on the embedding, or pose, of the 3D shape. Think for instance of two human shapes, one of them having its right hand raised and not the other; the humans are identical, only their poses differ. Then, the right hand points of the two shapes will differ a lot, even though they share the same label.
TDA to the rescue!
This is where persistence diagrams come into play. Thanks to their topological nature, persistence diagrams are intrinsic, meaning that they do not depend on the embedding, or pose, of the 3D shapes. Hence, they are good candidates for point features. To do this we thus need to define an intrinsic filtration.
This can be achieved with geodesic distances. The geodesic distance between two points on a 3D shape is the length of the shortest path on the shape between these two points. You can think of it as the length of the path that an ant would walk if it had to go from the first point to the second one. This distance is obviously intrinsic since the path that the ant would walk is independent from the pose of the 3D shape.
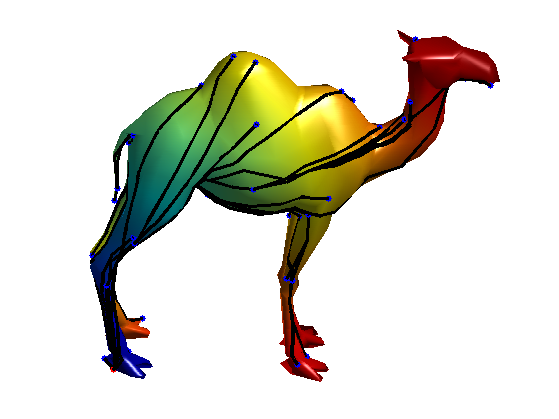
Example of geodesic distances computed for various pair of points on a 3D camel shape. Source: http://www.numerical-tours.com/matlab/shapes_2_bendinginv_3d/
Geodesic distances can then be used to define geodesic balls. A geodesic ball with radius r > 0 and centered on a point x is simply the set of points of the shape whose geodesic distance to x is less or equal than r. Again, by making rincrease from 0 to infinity, we make the geodesic ball grow from the singleton {x} to the whole shape itself, which gives us an intrinsic filtration. Now, to compute the corresponding persistence diagram, we record the radii for which topological events occurred in the ball and use them as coordinates. In the case of 3D shapes, the topological events are quite limited: since 3D shapes are connected surfaces, their intrinsic dimension is 2 (indeed, a 3D shape locally looks like a flat plane), and the only topological events that may occur is the appearance or filling of holes in the ball. For example, take a look at the filtration displayed below on a 3D hand shape.
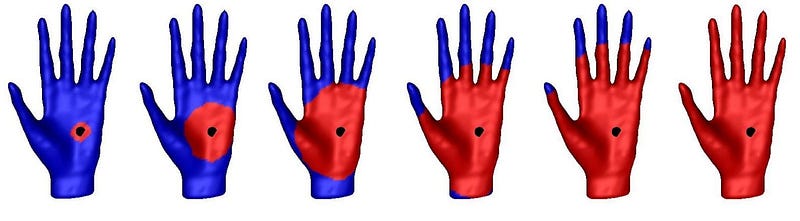
Example of geodesic ball filtration computed for a point located on the palm of a 3D hand shape.
The growing geodesic ball is shown in red while the remaining of the shape is in blue. For the first three radii, the geodesic ball has no interesting topology: it looks just like a disc. However, for the fourth radius, each of the five fingers created a hole in the geodesic ball: five topological events appeared. They persist through the fifth radius, and eventually get filled in for the sixth radius. The corresponding persistence diagram, that I display below, thus contains five points.
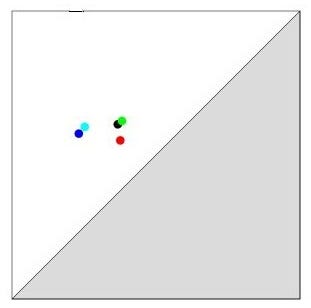
Each point of the persistence diagram corresponds to a specific finger of the shape.
What makes things more interesting is that if I apply the same process on a point located on another part of the shape, then the diagram is going to be different. Let us for example consider a point located on the middle finger:
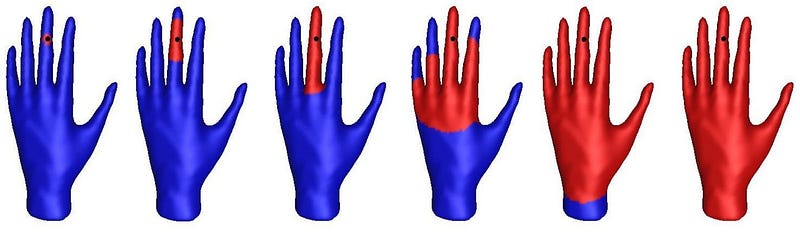
Geodesic ball filtration computed for a point located on the middle finger.
All fingers will again create holes in the geodesic ball, but at different radii. For instance, the hole corresponding to the middle finger appeared and got filled in much earlier than for the first filtration. In the persistence diagram, the corresponding point is thus located farther apart from the other points.
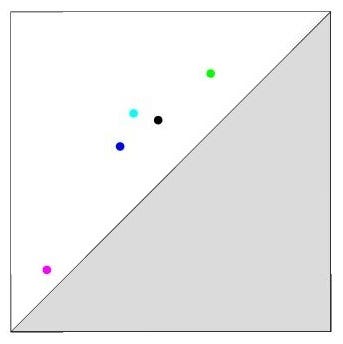
The point corresponding to the middle finger (pink) is far from the others.
Generally speaking, the persistence diagram points have different configurations depending on the location, or part, to which the 3D shape point (which was used to compute the diagram) belongs. This illustrates the fact that persistence diagrams are accurate descriptors for segmentation. I implemented code for the computation of such diagrams: see my Github if you want to give it a try.
Time to learn!
Finally! Now that we have a good feature, or descriptor, of the points, we are ready to do Machine Learning (ML).
Or are we?
A big issue of persistence diagrams is their non structured form: persistence diagrams are sets which may contain different number of points. They are not as easy to handle as traditional Euclidean vectors, which are the common food for ML algorithms. This is why a huge effort is currently devoted in the TDA community to derive ways to process persistence diagrams in ML. As of today, the two main approaches are either to compute vectors out of diagrams (such as persistence images or landscapes), or to define kernels on diagrams and use kernelized ML algorithms (such as PCA or SVM). See this story for more details.
I implemented most of this approaches in a python package that is scikit-learn compatible. Again, I refer the interested reader to my Github. Thanks to this package, all methods can be compared and used in a big cross validation procedure. In my notebook, I used this to perform segmentation of a bunch of 3D surfaces representing airplanes of various size and shape (see sample of code below). Final accuracy can go up to 90%, which is quite good given the difficulty of the task!
# Definition of pipeline
pipe = Pipeline([("Separator", tda.DiagramSelector(limit=np.inf, point_type="finite")),
("Rotator", tda.DiagramPreprocessor(scaler=tda.BirthPersistenceTransform())),
("TDA", tda.PersistenceImage()),
("Estimator", SVC())])
# Parameters of pipeline. This is the place where you specify the methods you want to use to handle diagrams
param = [{"Rotator__use": [False],
"TDA": [tda.SlicedWasserstein()],
"TDA__bandwidth": [0.1, 1.0],
"TDA__num_directions": [20],
"Estimator": [SVC(kernel="precomputed")]},
{"Rotator__use": [False],
"TDA": [tda.PersistenceWeightedGaussian()],
"TDA__bandwidth": [0.1, 1.0],
"TDA__weight": [lambda x: np.arctan(x[1]-x[0])],
"Estimator": [SVC(kernel="precomputed")]},
{"Rotator__use": [True],
"TDA": [tda.PersistenceImage()],
"TDA__resolution": [ [5,5], [6,6] ],
"TDA__bandwidth": [0.01, 0.1, 1.0, 10.0],
"Estimator": [SVC()]},
{"Rotator__use": [False],
"TDA": [tda.Landscape()],
"TDA__resolution": [1000],
"Estimator": [RandomForestClassifier()]},
{"Rotator__use": [False],
"TDA": [tda.WassersteinDistance()],
"TDA__wasserstein": [1],
"TDA__delta": [0.1],
"Estimator": [KNeighborsClassifier(metric="precomputed")]}
]
One final word…
Geometry processing is only one out of many possible applications of TDA. This field is very active since it connects different areas of mathematics from algebraic topology to computer science, and more and more people are becoming TDA enthusiasts. Do not miss the train! 😉