
Ready to learn Machine Learning? Browse courses like Machine Learning Foundations: Supervised Learning developed by industry thought leaders and Experfy in Harvard Innovation Lab.
Welcome to part four of Learning AI if You Suck at Math. If you missed part 1, part 2 and part3 be sure to check them out.
Maybe you’ve downloaded TensorFlow and you’re ready to get started with some deep learning?
But then you wonder: What the hell is a tensor?
Perhaps you looked it up on Wikipedia and now you’re more confused than ever. Maybe you found this NASA tutorial and still have no idea what it’s talking about?
The problem is most guides talk about tensors as if you already understand all the terms they’re using to describe the math.
Have no fear!
I hated math as a kid, so if I can figure it out, you can too! We just have to explain everything in simpler terms.
So what is a tensor and why does it flow?
Tensors = Containers
A tensor is the basic building block of modern machine learning.
At its core it’s a data container. Mostly it contains numbers. Sometimes it even contains strings, but that’s rare.
So think of it as a bucket of numbers.
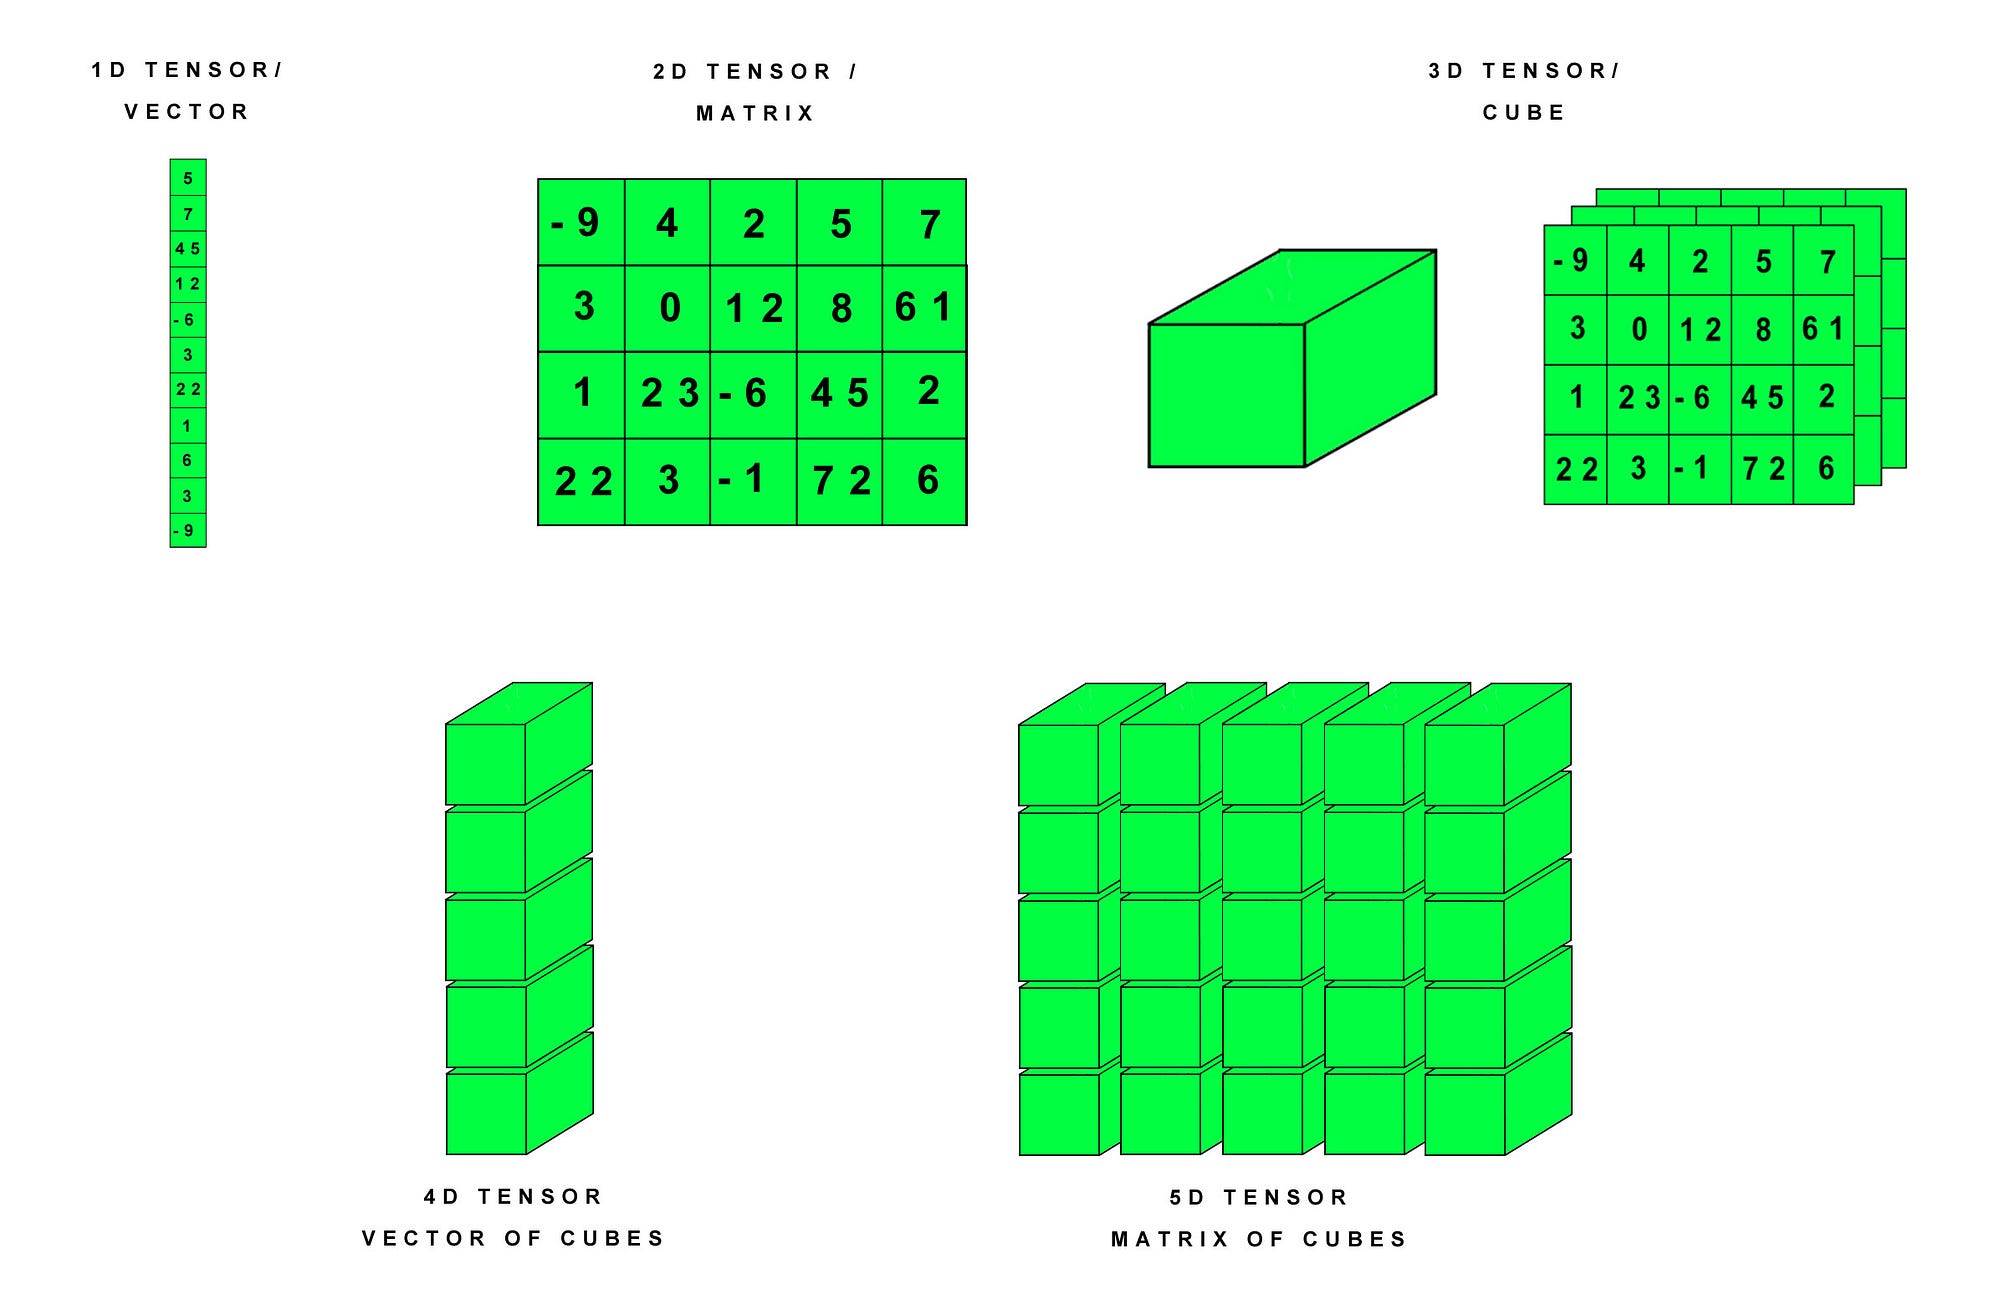
There are multiple sizes of tensors. Let’s go through the most basic ones that you’ll run across in deep learning, which will be between 0 and 5 dimensions.
We can visualize the various types of tensors like this (cats come later!):
0D Tensors/Scalars
Every number that goes into a tensor/container bucket is called a “scalar.”
A scalar is a single number.
Why don’t they just call it a number you ask?
I don’t know. Maybe math peeps just like to sound cool? Scalar does sound cooler than number.
In fact you can have a single number tensor, which we call a 0D tensor, aka a tensor with 0 dimensions. It’s nothing more than a bucket with a one number in it. Imagine a bucket with a single drop of water and you have a 0D tensor.
In this tutorial we’ll use Python, Keras and TensorFlow, as well as the Python library NumPy. We set all of that up in my last tutorial, Learning AI if You Suck at Math (LAIYSAM) — Part 3, so be sure to check that out if you want to get your deep learning workstation running fast.
In Python, these tensors are typically stored in a NumPy arrays. NumPy is a scientific library for manipulating numbers that is used by pretty much every AI framework on the planet.
import numpy
x = np.array(5)
print(x)
Our output is:
5
On Kaggle (the data science competition site) you will often see Jupyter Notebooks (also installed in LAIYSAM -Part 3) that talk about turning data into a NumPy arrays. Jupyter notebooks are essentially a markup document with working code embedded. Think of it as an explanation and program rolled into one.
Why the heck would we want to turn data into a NumPy array?
Simple. Because we need to transform any input of data, be that strings of text, images, stock prices, or video into a universal standard that we can work with easily.
In this case we transform that data into buckets of numbers so we can manipulate them with TensorFlow.
It’s nothing more than organizing data into a usable format. In web programming you might represent via XML, so you can define its features and manipulate it quickly. Same thing. In deep learning we use tensor buckets as our basic Lego block.
1D Tensors/Vectors
If you’re a programmer, you already know about something similar to a 1D tensor: an array.
Every programming language has arrays, which are nothing but a string of data chunks in a single row or column. In deep learning this is called a 1D tensor. Tensors are defined by how many axes they have in total. A 1D tensor has exactly one axis.
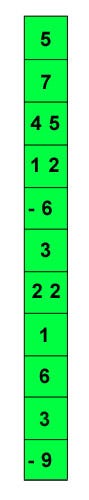
A 1D tensor is called a “vector.”
We can visualize a vector as a single column or row of numbers.
If we wanted to see this in NumPy we could do the following:
x = np.array([1,2,3,4])
print(x)
Our output is:
array([1,2,3,4])
We can also visualize how many axes a tensor has by using NumPy’s ndim function. Let’s try it with a 1D tensor.
x.ndim
Our output is:
1
2D Tensors
You probably already know about another kind of tensor: a matrix.
A 2D tensor is called a matrix.
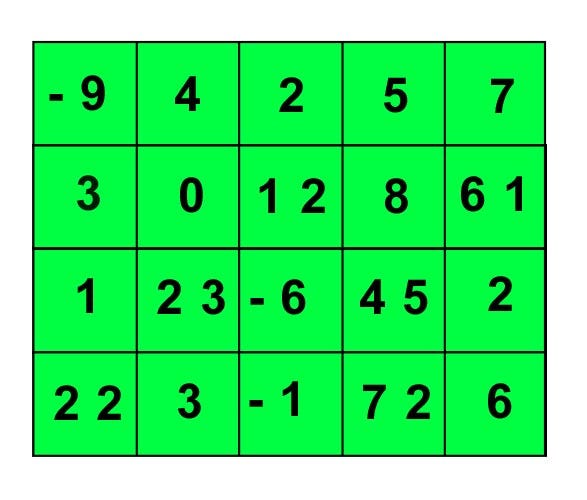
No, not the movie with Keanu Reeves. Think of an Excel sheet.
We can visualize this as a grid of numbers with rows and columns.
Those columns and rows represent two axes. A matrix is a 2D tensor, meaning it is two dimensional, aka a tensor with 2 axes.
In NumPy we would represent that as:
x = np.array([[5,10,15,30,25],
[20,30,65,70,90],
[7,80,95,20,30]])
We can store characteristics of people in a 2D tensor. For example, a typical mailing list would fit in here.
Let’s say we have 10,000 people. We also have the following features or characteristics about each person:
- First Name
- Last Name
- Street Address
- City
- State
- Country
- Zip
That means we seven characteristics for each of our ten thousand people.
A tensor has a “shape.” The shape is a bucket that fits our data perfectly and defines the maximum size of our tensor. We can fit all the data about our people into a 2D tensor that is (10000,7).
You might be tempted to say it has 10,000 columns and 7 rows.
Don’t.
A tensor can be transformed or manipulated so that columns become rows and vice versa.
3D Tensors
This is where tensors really start to get useful. Often we have to store a number of examples of 2D tensors in their own bucket, which gives us a 3D tensor.
In NumPy we could represent it as follows:
[20,30,65,70,90],
[7,80,95,20,30]]
[[3,0,5,0,45],
[12,-2,6,7,90],
[18,-9,95,120,30]]
[[17,13,25,30,15],
[23,36,9,7,80],
[1,-7,-5,22,3]]])
A 3D tensor has, you guessed it, 3 axes. We can see that like so:
x.ndim
Our output is:
3
So let’s take our mailing list above. Now say we have 10 mailing lists. We would store our 2D tensor in another bucket, creating a 3D tensor. It’s shape would look like this:
(number_of_mailing_lists, number_of_people, number_of_characteristics_per_person)
(10,10000,7)
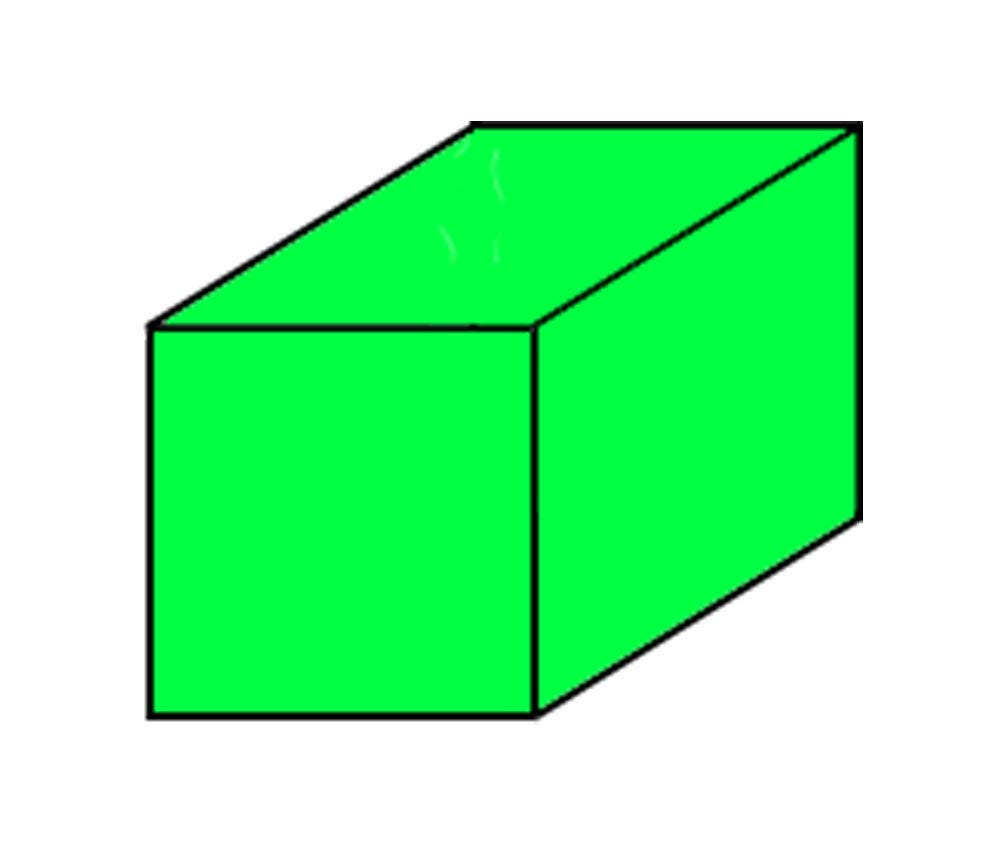
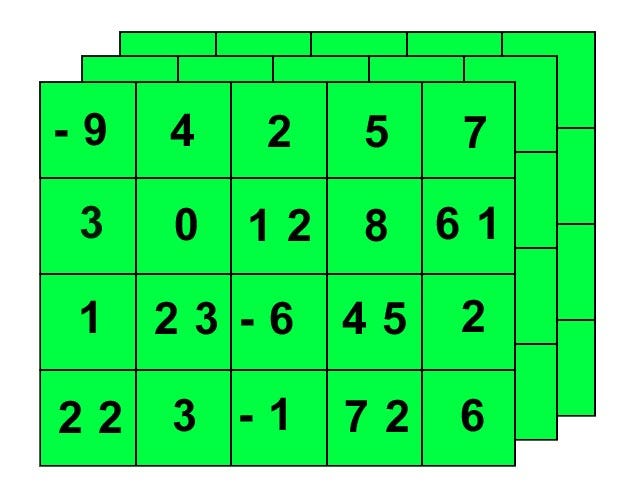
You might have already guessed it but a 3D tensor is a cube of numbers!
We can keep stacking cubes together to create bigger and bigger tensors to encode different types of data aka 4D tensors, 5D tensors and so on up to N. N is used by math peeps to define an unknown number of additional units in a set continuing into the future. It could be 5, 10 or a zillion.
Actually, a 3D tensor might be better visualized as a layer of grids, which looks something like the graphic below:
Common Data Stored in Tensors
Here are some common types of datasets that we store in various types of tensors:
- 3D = Time series
- 4D = Images
- 5D = Videos
In almost every one of these tensors the common thread will be sample size. Sample size is the number of things in the set. That could be the number of images, the number of videos, the number of documents, or the number of tweets.
Typically, the actual data will be one less the sample_size:
rest_of_dimensions - sample_size = actual_dimensions_of_data
Think of the various dimensions in the shape as fields. We are looking for the minimum number of fields that describe the data.
So even though a 4D tensor typically stores images, that’s because sample size takes up the 4th field in the tensor.
For example, an image is really represented by three fields, like this:
(width, height, color_depth) = 3D
But we don’t usually work with a single image or document in machine learning. We have a set. We might have 10,000 images of tulips, which means we have a 4D tensor, like this:
(sample_size, width, height, color_depth) = 4D
Let’s look at multiple examples of various tensors as storage buckets.
Time Series Data
3D tensors are very effective for time series data.
Medical Scans
We can encode an electroencephalogram EEG signal from the brain as a 3D tensor, because it can be encapsulated as 3 parameters:
(time, frequency, channel)
The transformation would look like this:
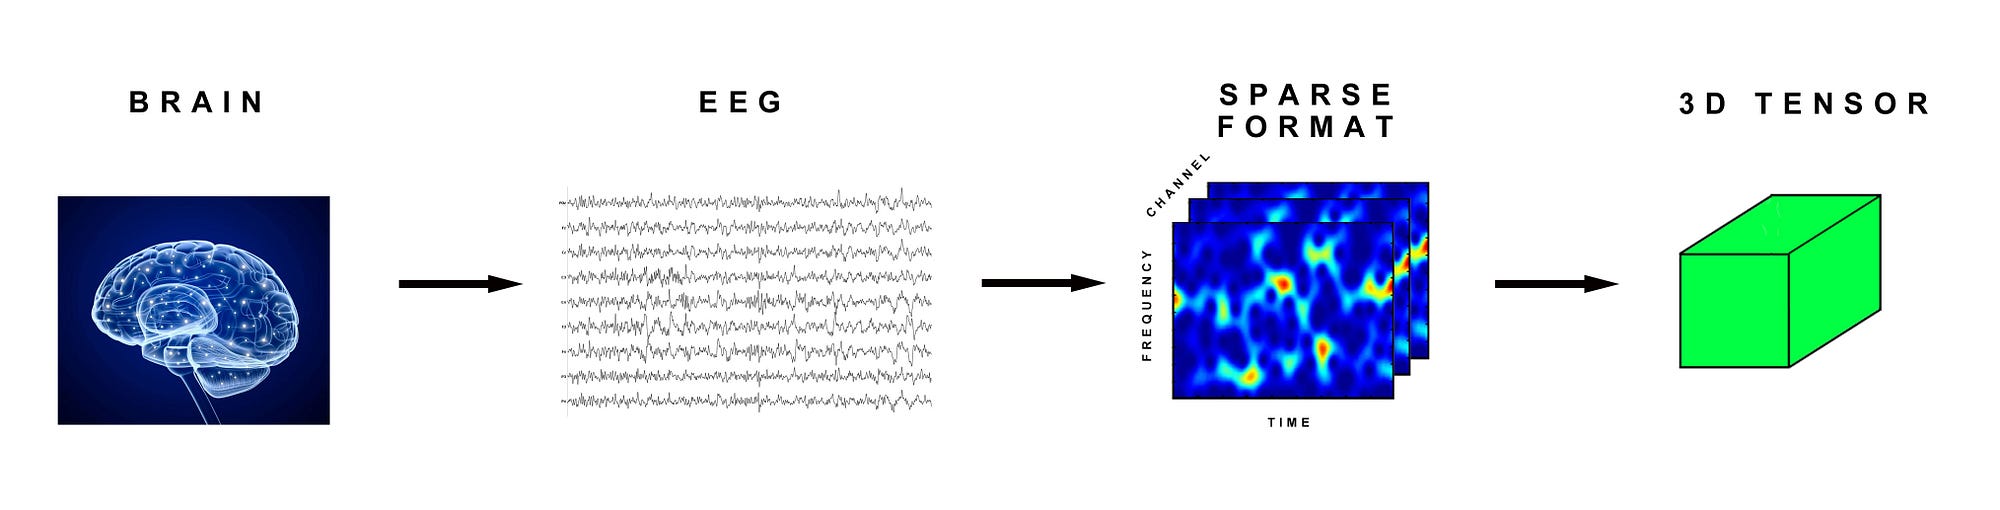
Now if we had multiple patients with EEG scans, that would become a 4D tensor, like this:
(sample_size, time, frequency, channel)
Stock Prices
Stock prices have a high, a low and a final price every minute. The New York Stock Exchange is open from 9:30 AM to 4 PM. That’s 6 1/2 hours. There are 60 minutes in an hour so 6.5 x 60 = 390 minutes. These are typically represented by a candle stick graph.
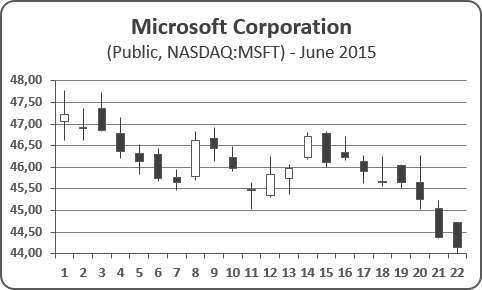
We would store the high, low and final stock price for every minute in a 2D tensor of (390,3). If we captured a typical week of trading (five days), we would have a 3D tensor with the shape:
(week_of_data, minutes, high_low_price)
That would look like this:
(5,390,3)
If we had a 10 different stocks, with one week of data each, we would have a 4D tensor with the following shape:
(10,5,390,3)
Let’s now pretend that we had a mutual fund, which is a collection of stocks, which is represented by our 4D tensor. Perhaps we also have a collection of 25 mutual funds representing our portfolio, so now we have a collection of 4D tensors, which means we have a 5D tensor of shape:
(25,10,5,390,3)
Text Data
We can store text data in a 3D tensor too. Let’s take a look at tweets.
Tweets are 140 characters. Twitter uses the UTF-8 standard, which allows for millions of types of characters, but we are realistically only interested in the first 128 characters, as they are the same as basic ASCII. A single tweet could be encapsulated as a 2D vector of shape (140,128).
If we downloaded 1 million Donald Trump tweets ( I think he tweeted that much last week alone) we would store that as 3D tensor of shape:
(number_of_tweets_captured, tweet, character)
That means our Donald Trump tweet collection would look like this:
(1000000,140,128)
Images
4D tensors are great at storing a series of images like Jpegs. As we noted earlier, an image is stored with three parameters:
- Height
- Width
- Color depth
The image is a 3D tensor, but the set of images makes it 4D. Remember that fourth field is for sample_size.
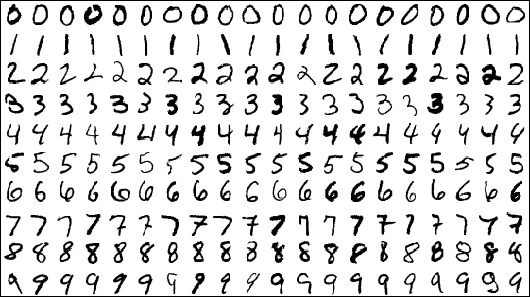
The famous MNIST data set is a series of handwritten numbers that stood as a challenge for many data scientists for decades, but are now considered a solved problem, with machines able to achieve 99% and higher accuracy. Still, the data set remains a good way to benchmark new machine learning applications, or just to try things out for yourself.
Keras even allows us to automatically import the MNIST data set with the following command:
(train_images, train_labels), (test_images, test_labels) = mnist.load_data()
The data set is split into two buckets:
- training set
- test set
Each of the images in the sets has a label. This label gives the image the correct identification, such as the number 3 or 7 or 9, which was added by hand by a human being.
The training set is used to teach a neural net and the test set contains the data the network tries to categorize after learning.
The MNIST images are gray scale, which means they could be encoded as a 2D tensor, however all images are traditionally encoded as 3D tensors, with the third axis being a representation of color depth.
There are 60,000 images in the MNIST dataset. They are 28 pixels wide x 28 pixels high. They have a color depth of 1, which represents gray scale.
TensorFlow stores image data like this:
(sample_size, height, width, color_depth).
So we could say the 4D tensor for the MNIST dataset has a shape of:
(60000,28,28,1)
Color Images
Color photos can have different color depths, depending on their resolution and encoding. A typical JPG image would use RGB and so it would have a color depth of 3, one each for each red, green, blue.
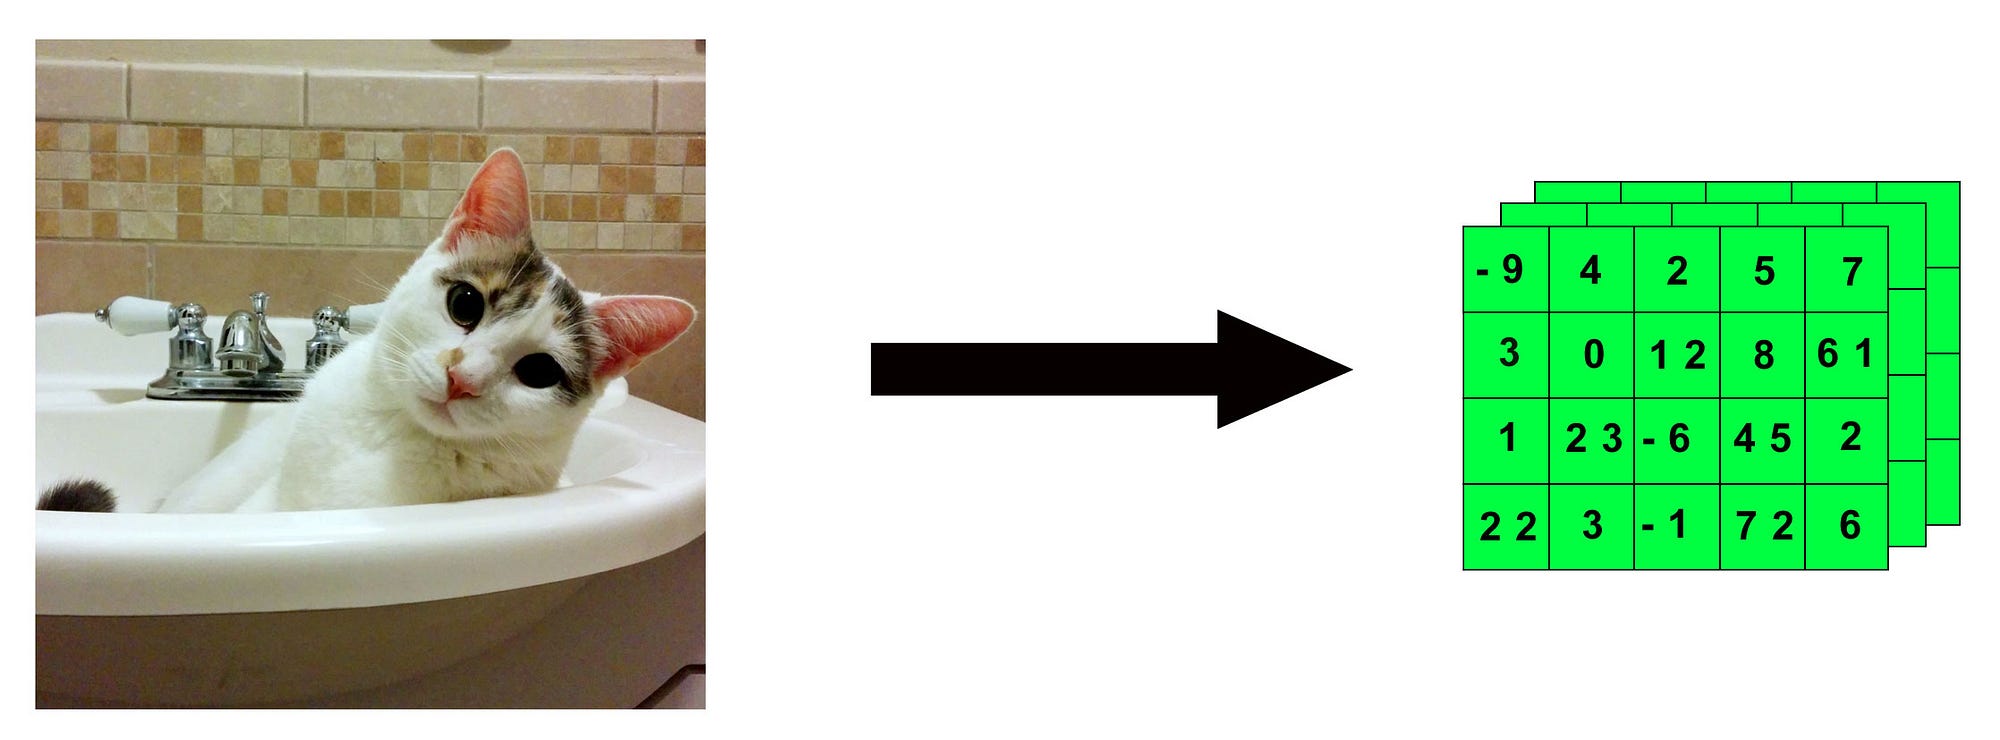
This is a picture of my awesome cat Dove. It’s a 750 pixel x 750 pixel image. (Actually it’s 751 x 750 because I cut it wrong in Photoshop, but we’ll pretend it is 750 x 750). That means we have a 3D tensor with the following characteristics:
(750,750,3)

My beautiful cat Dove (750 x 750 pixels)
Hence my Dove would get reduced to a series of cold equations that would look like this as it “transformed” or “flowed.”
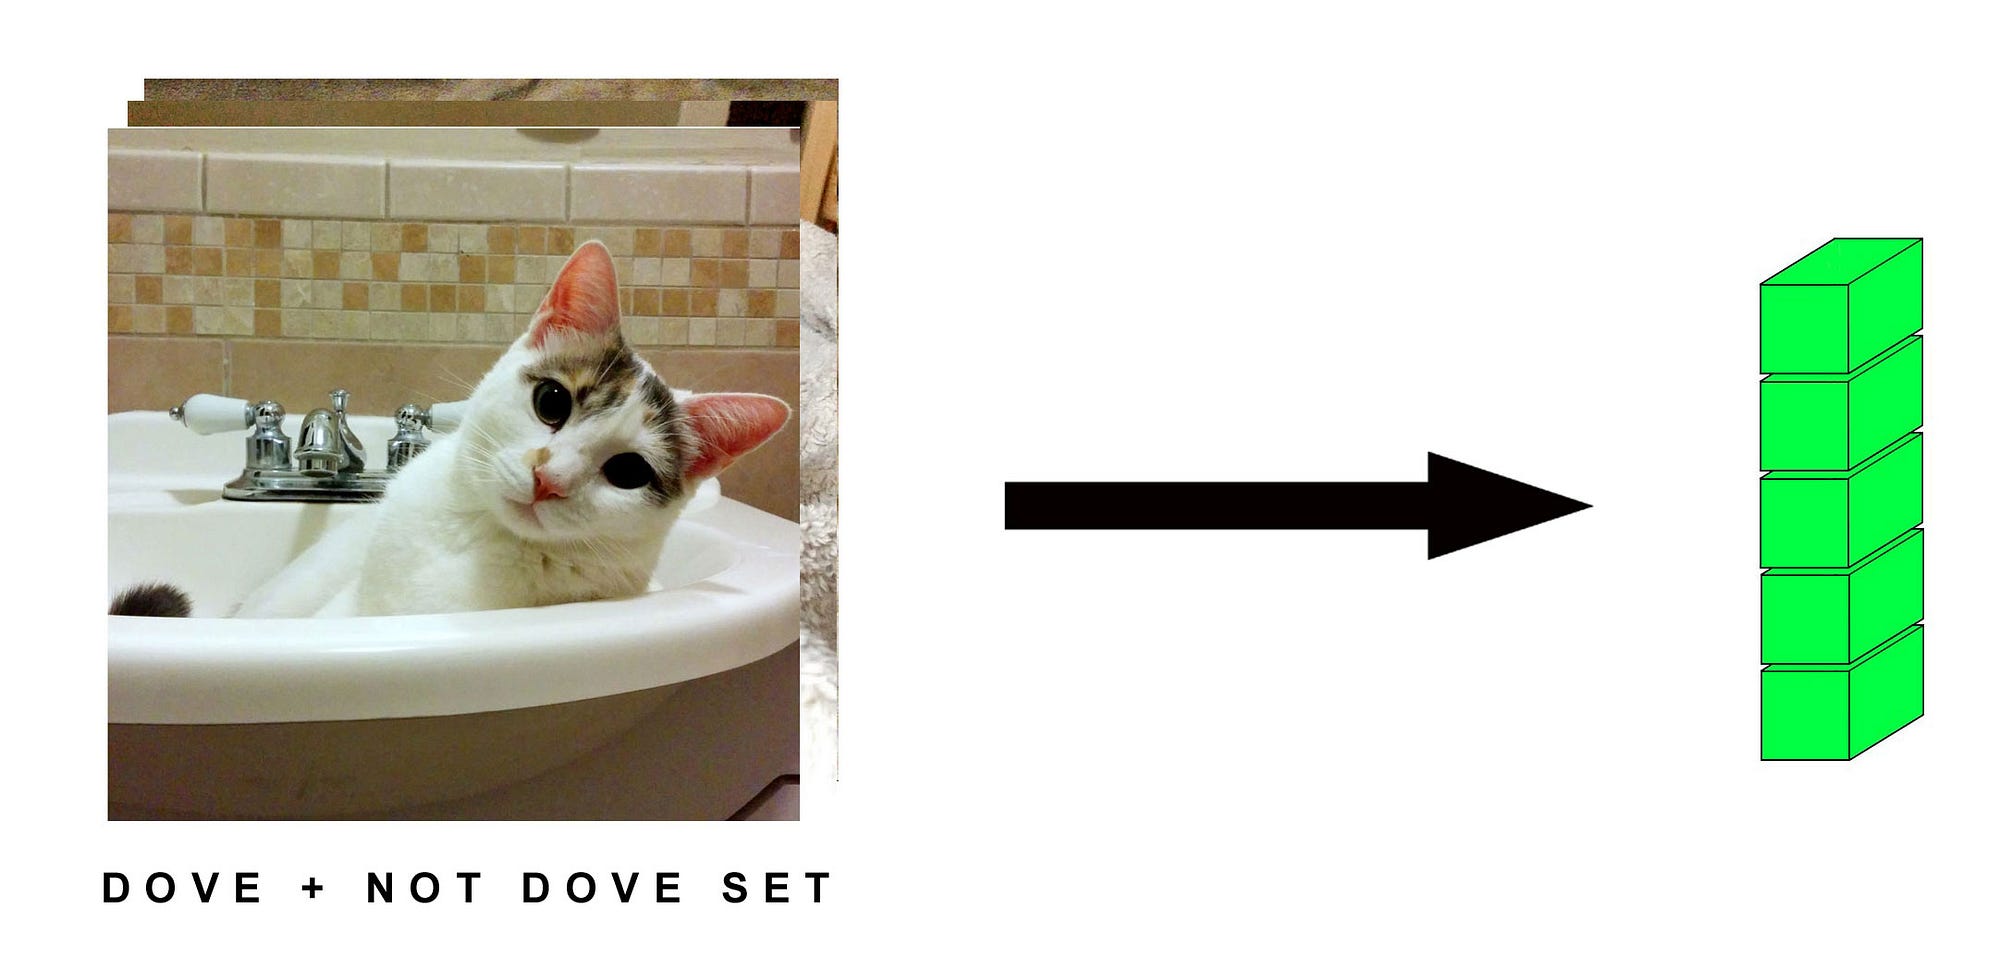
Then let’s say we had a bunch of images of different types of cats, (though none will be as beautiful as Dove). Perhaps we have 100,000 not-Dove cats that were 750 pixels high by 750 pixels wide. We would define that set of data to Keras as a 4D tensor of shape:
(10000,750,750,3)
5D Tensors
A 5D tensor can store video data. In TensorFlow video data is encoded as:
sample_size, frames, width, height, color_depth)
If we took a five minute video (60 seconds x 5 = 300), at 1080p HD, which is 1920 pixels x 1080 pixels, at 15 sampled frames per second (which gives us 300 seconds x 15 = 4500), with a color depth of 3, we would store that a 4D tensor that looks like this:
(4500,1920,1080,3)
The fifth field in the tensor comes into play when we have multiple videos in our video set. So if we had 10 videos just like that top one, we would have a 5D tensor of shape:
(10,4500,1920,1080,3)
Actually this example is totally insane.
The size of the tensor would be absolutely ridiculous, over a terabyte. But let’s stick with it for a moment as there’s a point to doing it. Know that in the real world, we would want to down-sample the video as much as possible to make it more realistic to deal with or we would be training this model until the end of time.
The number of values in this 5D tensor would be:
10 x 4500 x 1920 x 1080 x 3 = 279,936,000,000
Keras allows us to store things as floating point numbers with 32 bits or 64 bits with a data value call (dtype):
float32
float64
Each of these values would be stored as a 32 bit number, which means that we multiply the total number of values by 32 to transform it into bits and then convert it to Terabytes.
279,936,000,000 x 32 = 8,957,952,000,000
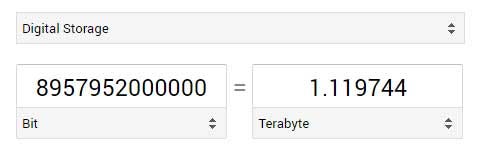
I don’t even think the values would fit in a float32 (I’ll let someone else do the math on that), so get down-sampling my friend!
Actually, I used this last insane example for a reason.
You just got your first lesson in pre-processing and data-reduction.
You can’t just hurl data at an AI model with no work on your part. You have to massage and shrink the data to make it easier to work with efficiently.
Reduce the resolution, drop unneeded data (aka deduping), limit the number of frames you use, etc, etc. That is the work of a data scientists.
If you can’t munge the data, you can’t do anything useful with it.
Conclusion
There you have it. Now you have a much better understanding of tensors and the types of data that fit in them.
In the next post we’ll learn how to do various transformations on the tensors, also known as math.
In other words, we’ll make the tensors “flow.”